An enthusiastic claim we often hear is that school feeding programs have a positive impact on the attendance and academic performance of the students. In 16 focus groups we conducted, school directors said it, teachers said it, parents said it, even some of the children spontaneously made claim. I too have always simply assumed that it’s true. And of course, the World Food Program says it, as does USAID. To prove it, some WFP staff asked us to test it. So we examined changes in rates of enrollment as well as rates in pass, fail and drop-out in and area of the Department Nippes before a WFP school program existed vs. after. We also compared these rates to schools in the region that were not involved in the program. We found no evidence that the program had a positive impact on grades or dropout rates. Here’s a summary of the data.
Test of Impact of School Feeding on the Scholastic Performance of Children in Rural Haiti


Methodology
The evaluation included 12 of the 23 schools involved in the feeding program and that were randomly chosen for study. We were able to obtain data for 8 of the 12 schools in the program and that were used in the evaluation. The data covered the school years,
- 2014-15, before the program was in place
- 2015-16, the first year of the program and
- 2016-17, the second year for feeding program, but interrupted by hurricane Matthew
We also compared findings from those schools in the program to 10 schools in neighboring commune of Petite Trou, none of which were included in the school feeding program (Five schools were eliminated from the test: two because they had canteens prior to the program and three because of a lack of data.[1]
We analyzed individual class-grades 1st thru 6th grade for each school (here on referred to simply as classes). For those in the program, this amounted to a total of 48 classes. For those schools not in the program, this amounted to a total of 60 classes.
The Sign Test was used to evaluate statistical significance. The sign test replaces absolute numbers with simple directional signs. For example, if a particular class in a particular school had more students enrolled in 2015-16 than in 2014-15, that observation would be scored as +1, indicating enrollment had increased. If there had been fewer students, the change would have been scored as -1, indicating a decline in enrollment. What makes the Sign Test especially useful and appropriate for evaluating changes in the school feeding program is that it omits the specific degree of change for any one school, something that might bias results as a consequence of inordinately large changes from a single class or school.[i] If one school had a dramatic increase in school enrollment—for example, doubling the number of student in all classes—it would not inordinately impact the overall pattern for all schools. In summary, no matter how great or how small the change for any particular class, the Sign Test method means that it is scored as a simple +1 or -1, making the Sign Test highly sensitive to any trends in the overall data.
Results
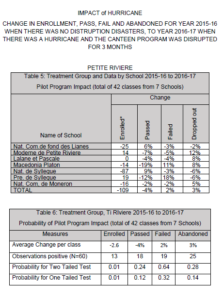
Based on the tests of the treatment group, i.e. those schools in the program, we would have to conclude that from the period when there was no program (school year 2014-15) to the first year of the program (school year 2015-16) there was no statistically significant impact on any of the parameters in question: not on the number of students enrolled per class, not on the proportion who passed, and not on the proportion who failed or abandoned school.
In the 10 treatment group schools in neighboring Petit Trou where there is no program, we found a statistically significant decline of 4.2 students per class (p<.01) and a 2 percent increase in the number who abandoned.
Similarly, we find the same trends for the first year of the program (school year 2015-16) to the year of the hurricane (2016-17): specifically, no evidence of any statistically significant changes for any parameter for the program schools in Petite Rivye; but, for the control schools in Petite Twou, enrollment declined by 4.6 students per class (p<.01), the percentage who failed increased by 1 percent (p<.01), and the proportion who abandoned school during the year increased by 2 percent (p<.01).


NOTES
[i] One reason the sign test is especially appropriate is that, technically, the statistical sampling strategy we used is flawed. It violates the assumption of independences among sampled units. More specifically, we have data for only 8 schools; and because of the devastating impact of hurricane Matthew in in 2016, we can evaluate rates of change for only the years 2014-15- to -2015-16 (the school year before the canteen program and the first year of the program). Thus, we cannot test and compare by entire school because we do not have enough schools and we only have the change from one year to evaluate. To compensate, we have used grades, there being 6 grades in each primary school, thereby yielding 48 observations for the sample of 8 treatment schools and 60 observations for the 10 schools in the control group (in the main text these class-grades are referred to simply as classes).
Email Updates
Get notified when new research is released by signing up below.