A picture is indeed worth a thousand words.
What is the MEVM Strategy?
MEVMS (Multi-Dimensional Ethnographic Value-Chain Mapping Strategy) is an intuitive, user-friendly research and presentation strategy for creatively documenting, organizing, understanding, and explaining Value Chain networks for a product or service that generates critical income to an economically insecure population. Data on a value chain is gathered or existing information pulled together from traditional focus groups, key informant interviews, surveys, and Cultural Consensus Analytics. A holistic map of the production, processing, and distribution actors and channels is then built of highly graphic icons that illustrate intuitively pan-human symbols for action, emotion, threats and rewards. Once mapped, the value-chain is framed in the most powerful understanding of society that social sciences has to offer: the formulation of the infrastructure (environmental, demographic, technological & economic resources and constraints), structure (social and institutional resources and constraints) and superstructure (ideological resources and constraints). The material-institutional-ideological model is then used as a framework for identifying the resources and constraints that bear on the value chain. Because the map is highly graphic, it can be used as a medium for quickly sharing massive amounts of information with other aid practitioners as well as catalysts for engaging beneficiary populations. Identifying and analyzing the resources and constraints of the value chain with stakeholders leads to an understanding of the practical possibilities and limitations for humanitarian intervention. The ultimate objective is to identify opportunities to repair broken production and market chains or to improve the chain and thereby improve the economic well-being and resiliency of vulnerable populations.[i] [ii]
How It’s Done?
The mapping strategy is based on five steps.
- Identify the map elements and dimensions (basic information the map comprises)
- Select or create graphic icons and colors that illustrate those elements and dimensions
- Map those highly graphic icons and colors so that they illustrate the flow and relationships of the subject value-chain.
- Couch the resulting map in relevant information regarding the environmental, economic, social and ideological resources and constraints
- Identify the most promising points of intervention to strengthen the value chain
Elements
The MEVM is composed of elements or, more precisely, the products, people, places, transport, technologies, qualities, and relations that describe the chain.
The researcher making a MEVM can create their own icons, borrow them from internet clipart sites or commons, or use icons from Socio-Dig’s library (available on request and soon to be provided online). Below we provide a list of the major categories of elements that should be mapped. For each sub-category we provide a few examples.
1. The product or service being studied (e.g. goats, shoes, fish, mangos)
![]()
2. The people involved in producing, processing, delivering, selling and consuming the product or service
- Producers (e.g. farmer, fishers)

- Processors (sawyers, weavers, charcoal makers, fish cleaners)

- Traders (e.g. retailers, intermediaries, wholesalers)

- Underwriters (lenders, financiers, investors)

- Official (tax collector, inspector)

- Consumers (See “Places,” below)
3. The Places
- Places of production (e.g. orchard, peasant homestead, industrial farm)

- Places of processing (e.g. home, workshop, factories)

- Places of procurement (e.g. seashore, reefs, forest)

- Places of distribution/outlets (e.g. Formal sector market, restaurant, informal market)

- Places of storage (e.g. barns, silos, warehouses)

4, Transport (e.g. porters, pack animal, moto, pickup, bus, sail powered boat, diesel boat, major ship, plane)
![]()
- Transport routes (e.g. foot path, tertiary road, paved road, river, ocean)
6. Productive Technologies
- Processed Packaging (e.g. fresh/basket, sun-dried or smoked, cooler, frozen/cold storage)

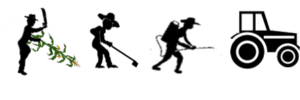
- Agricultural Technologies (e.g. machete, hoe, hand sprayer, tractor)
- Fishing Technologies (free-diving/spearfishing, weir, seine, net)

Dimensions
Dimensions are the relations of production, such as gender and age-based division of labor, dependence on reciprocity versus remuneration, and the extent to which an activity is embedded in the formal versus informal economy. The graphic representations of dimensions can sometimes be framed in icons such as those seen above, but the extent to which one aspect of a dimension prevails is best illustrated with colors, such as pink for female and blue for male, or more precisely, a mixture of pink and blue indicating the extent to which the activity is accomplished by men versus women. Green can indicate extreme cash orientation of an activity while yellow indicates the opposite extreme of pure reciprocity. Other dimensions that can be illustrated with color gradients are profit-oriented versus subsistence-oriented, something bound up in yet another graded dimension, dependency on household versus paid labor. Similarly, color gradients can illustrate the extent to which an activity, service or product is embedded in the informal versus the formal economy, the extent to which it is under state control versus autonomous, and the extent to which it is dependent on being imported versus locally produced. Color gradients that indicated a dimension can be embedded in the chart background itself, in textboxes with lists of items, or in a meter-line or thermostat image. Thermostat images are often preferred because this means that color used for qualitative dimensions can be isolated inside the thermostat, as it is isolated inside other icons, such as how blue and pink are used inside human-image icons to illustrate gender. This means that color gradients can also be used to indicate movement across the map from the categorical and sequentially ordered dimensions of production, processing, transport, sale and finally consumption. The choice of colors to illustrate the qualitative and categorical dimensions used is, as with the icons in the previous section, entirely at the discretion of the map maker. The goal is to create a map that engages viewers and facilitates understanding, while accurately summarizing the features of the value chain. The most common dimensions are as follows,
- Gender: relative female vs male participation in tasks.

- Age

- Measurement system (weight, quantity, volume)
![]()
- Grading systems or types, such as grades of eggs, ABC and D grades or fish in Haiti, classified as Pink, White or Blue fish

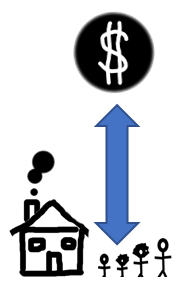
- Value added line: the increase in value at various stages of the value chain or regarding different grades of classes of the product
![]()
- Increase or decrease or decrease in income associated with changes in type of activities, such as change in income that might come with using vaccination

- Reciprocity meter
![]()
- Popularity meter

- Urban-Rural Continuum

- Household to Extra-Hshld
- Dependency on locally-procured vs. imported technology

- Other Icons (end of market chain, broken market chain, market opportunity)

Putting it All Together in a Map
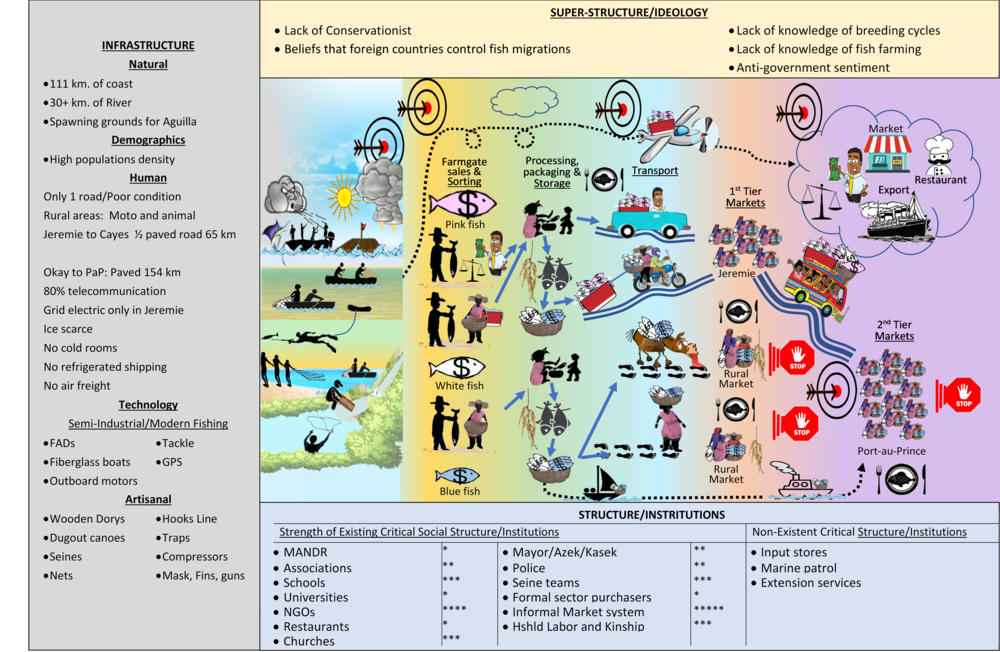
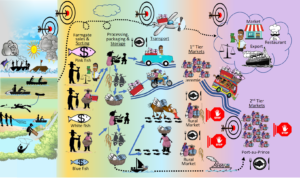
The next step is to actually create a map. The task is intuitively obvious. A presentation of an example map is presented below.
Example MEVM: Fishing in Haiti
The Constraints of the Map
The temptation at this point is to identify the threats, weaknesses, opportunities, and inputs that sustain or challenge the value-chain. The map-maker will have been identifying these features throughout the research and production of the map. But before we formally arrive at listing these features, it is more effective to put the map into the logical constraints. Specifically, frame the map in a description of the relevant Infrastructure, Social Structure, and Super Structure.[1]
- Infrastructure
- natural environment: sea, forests, rivers, savannah, mines, foliage, fishing grounds
- human infrastructure: demography, roads, transport, communication systems, technology
- Social Structure: Markets, stores, police, schools, associations, NGOs, ministries…
- Super Structure: Ideas, religions, taboos, celebrations
The Infrastructure, Structure and Superstructure are the constraints of the chain. They define what changes to the chain are practical within the context of what is available in the natural and social environments and the cultural beliefs and practices of the people. It may be that a development intervention can overcome a limitation in one or several of these spheres, but the current limitations should be identified and understood. The idea is not to exhaustively explain each category, but rather to catalog the existence or absence of those constraints of opportunities that are relevant. In this way, the strategy narrows the focus of discussion to a framework of practical options, thereby helping to catalyze the decision-making process regarding development interventions. Following the final map we provide a single paragraph summarizing the opportunities and constraints.
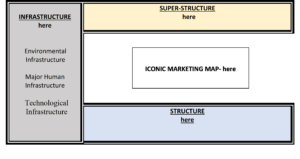
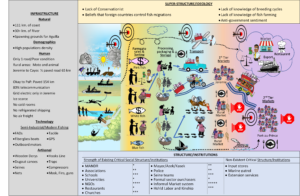
Below is a more complete listing of the constraints of the Value-Chain Network (infrastructure, structure and superstructure) with the items needed for the actual map listed where the map will be located.

Once again using the fishing map seen earlier, a completed map would look like the following:

Example of a report using the MEVM strategy: Value_Chains_HE_8_25_18
Examples of maps leading up to and instrumental in the development of the MEVM strategy:
NOTES
[i] As defined in USAID 2017.Enumerator Guidance: Full Model. A GUIDE FOR IMPLEMENTING A RESILIENCE MODULE, p. 2. Specifically,
Absorptive capacity: the ability to minimize exposure to shocks and stresses through preventative measures and appropriate coping strategies to avoid permanent, negative impacts.
Adaptive capacity: making proactive and informed choices about alternative livelihood strategies based on an understanding of changing conditions.
Transformative capacity: the governance mechanisms, policies/regulations, infrastructure, community networks, and formal and informal social protection mechanisms that constitute the enabling environment for systemic change.
[ii] The Strategy is inspired by the work of the NGO Practical Action’s Mike Albu and Griffith (2005) and Albu and Murphy (2007) and is the logical growth and evolution of the EMMA (Emergency Market Mapping Assessment).