To identify most vulnerable beneficiaries, humanitarian organizations in Haiti have often used criteria based on expectations from elsewhere in the world, criteria that are often not based on data, and that, more often than not, fail in Haiti. The best and most controversial flood of examples comes from the World Bank/WFP/USAID supported HDVI (Humanitarian Deprivation and Vulnerability Index), discussed in detail in this article.
Background: Proxy Means Testing (PMT) in Haiti
Proxy Means Testing (PMT) has been increasingly used as a way of validating existing criteria intended to detect vulnerable households and a way of evaluating the utility of new criteria. The goal of PMT is to derive a multidimensional set of parameters by which vulnerable or qualifying households or individuals can be identified. It involves the analysis of data from representative sample surveys to derive statistically valid indicators (criteria). Since the year 2000 there has been a growing body of proxy-means studies focused on discriminating degrees of vulnerability among the Haitian poor. All have yielded disappointing results (FAFO 2001, 2003; Fuller 2006; Schreiner 2006; Echevin 2011).
One of the most thorough searches for a Proxy Means Test was Schreiner (2006), who drew on 250 potential indicators that FAFO (2001, 2003) identified in the 7,168 Household and Living Conditions Survey (2001). He then refined this number to 100 indicators and tested them against income to determine the best predictors for an individual who lives on less than US $1 per day (considering the World Bank criteria for ‘extremely poor’–US $1.25). Echevin (2011) has done something similar to calculate poverty based on assets. His variables include many of the same included in the Kore Lavi PMT, the HDVI mentioned at the beginning of this article. For five years now, partners in the Kore Fanmi and Kore Lavi programs have been using such variables to develop indicators to select the most vulnerable beneficiaries with the hope of developing, “a single targeting tool that can be used by all programs working in Haiti to distinguish household vulnerability.” As will be seen in detail below, the irony is that there is not now nor ever was any supporting logic to many of their variables, making it difficult to understand how the world’s most powerful donor and implementing agencies could have gotten it so wrong, and kept getting it wrong for five years.[i]
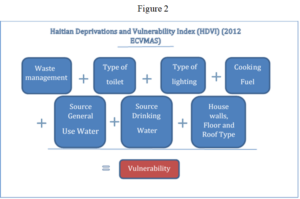
Indeed, they should have known that the HDVI was a bust before they even started. The most recent PMT models and those most instrumental in developing the Kore Lavi/Fanmi model were analyses such as 2012 ECVMAS Household Living Conditions Survey used to develop the HDVI (see Figure 3), and an unpublished analysis from World Bank consultants using the 3,501 households 2013 CNSA survey (described below) to test similar variables against a synthesis of Food Consumption Scores and Food Coping Strategies. As with PMT explorations before them (such as Scheiner 2006 and Echevin 2011), the statistical analysis of these programs—conducted independently of CNSA–suggests that in trying to discriminate between individual households the formulas may be only slightly better than random. To understand why, we begin with a review of the HDVI (the model using variables similar to those used in Kore Fanmi and many of those in the earlier Schriener 2006 and Echvin 2011 models). Specifically, the HDVI used the following model (Figure 3).
Review of HDVI Infrastructural Indicators of Vulnerability
The most striking thing about the HDVI indicators in Figure 2 is that they are not simply useless, they may be indicating the opposite of what they’re intended to indicate: they may be discriminating against those most in need of aid and selecting for those households and individuals who are less vulnerable. And just as alarming, there is abundant data available to scholars and aid workers who came up with the model to demonstrate the error. Below are list the more obvious examples.
Electricity: 85% of rural Haitian households have no electricity at all (EMMUS 2012). The 15% that do have electricity–mostly households located in villages and those on town peripheries– connect illegally to the nearest electric pole (the same is true for the majority of the 72% of urban population with electricity) giving way to the paradox that the rural “poor” more often have access to electricity than the rural “non-poor” (4% vs. 2%) (Sletten and Egset 2004: 17). Thus, more than useless as an indicator of rural household vulnerability, it is a counter-predictor: the poorer someone in the rural areas is, the more likely they are to have electricity. [ii]
Lighting: Anecdotally, the distinction in lighting used in rural households is most often between battery operated lamps, glass kerosene lamps, and tin milk can lamps, distinctions not captured in the 2012 ECVMAS Living Conditions Survey.
Cooking Fuel: The distinction between a household that uses wood to cook is almost entirely a rural vs. urban phenomenon: 80% of those in the city use charcoal, 73% of those in the rural areas use wood, once again rendering the category meaningless in detecting vulnerability (EMMUS 2012).
Water source: In all of Haiti, only 9.2% of households have an on-premises water source; 34% must travel more than 30 minutes to retrieve water. For those in rural areas the figures are more extreme: only 4.8% of rural homesteads have water on the premises (heavily skewed by specific regions, such as the irrigated Artibonite); 42.6% must travel more than 30 minutes to retrieve w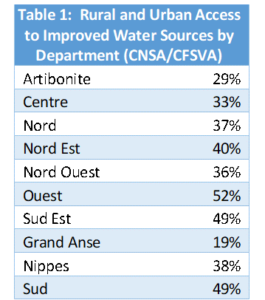 ater. (EMMUS 2012). Moreover, the type of water source and location of the water is almost entirely a function of, first, the natural environment and, second, NGOs and State, a point made clear from the 2008 survey finding that 49% of rural households get their water from a creek or river, 21% from a spring and 5% collect rain water (DINEPA 2012). Even if urban areas are included, no more than 52% of households in any of Haiti’s ten departments have access to an improved source of water (see Table 1). With the majority of households in a similar state of deprivation and water access being a function, not of individual household resources, but of region and service providers, the indicator ‘source of water’ is, once again, an essentially meaningless criteria for discriminating household-specific vulnerability. [iii]
Latrine: According to DINEPA (2012) 67% of rural households have either a simple hole in the ground or they have no latrine at all. According to the 2012 EMMUS, only 20% of households in Haiti have a private latrine classified in as ‘improved.’ Moreover, while there is no available data to prove it, we know anecdotally that many of the ‘improved latrines’ in rural areas have nothing to do with the wealth of the household but rather whether or not an NGO built the latrine as part of a relief project. If the NGOs that built the latrines targeted vulnerable households—and most do exactly that –the presence of latrine can, similar to electricity, be considered a counter-indicator, meaning that those who have the improved latrines may be poorer than those with nothing at all.
Waste disposal: In their landmark 2004 study Sletten and Egset noted that garbage collection, even for the rural non-poor, does not exist—at all. There are no official dumps, landfills, or garbage collection sites. The primary and only method of waste disposal– regardless of social class–is burning or throwing garbage in the nearest ravine (or paying someone else to do it), making the category, once again, meaningless in a rural analysis.
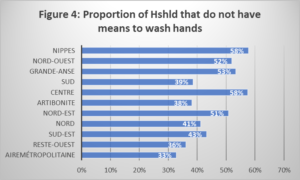
Hygiene: Kore Fanmi uses hand washing—or not hand washing—as an indicator of vulnerability. EMMUS surveyors estimated hand washing habits based on availability of soap and water or other hand sanitizing products (accomplished for 52% and 66% of all 13,181 households visited). But the sheer number of household that do not have these products available makes the measure questionable as an indicator of vulnerability (see Figure 4, below).
In short, most variables used in HDVI analysis do not discriminate between individual household vulnerability and some discriminate in a way that is misleading. Below we offer our own analysis of the Haitian Government CNSA’s data in an effort to search for a Proxy Means Model. But once again, the results do nothing to encourage the use of criteria to discriminate among inter-household vulnerability. As will be seen, using child malnutrition as a measure of vulnerability, the models yielded a 12% improvement over randomly guessing which households have a malnourished child: meaning that we would be wrong 67% of the time.
A 2013-14 Test of the HDVI with CNSA Survey Data
In 2013-2014, before the HDVI was accepted as a viable model, we tested the model with CNSA survey data. CNSA conducted a 3,501 household national survey (19,516 individuals). We used the data in an attempt to develop a statistical model to assess the predictability, based on Proxy Means Tests, of household vulnerability. Questions targeted the wide range of information listed below. As see,n, the test left no doubt the HDVI was an ineffective means for identifying vulnerable households.
Indicators of Vulnerability
There were two categories from which we could draw dependent variables to test whether independent variables were useful in a proxy means model for vulnerability:
- Reported consumption and diversity of food – it is based on reports from respondents regarding household consumption, variety of foods consumed, missed and reduced meals due to scarcity, and
- Nutritional variables HAZ, WAZ, and MUAC, the only concrete and measureable indicator of vulnerability
The problem with category 1 is that while considered by some as the “gold standard” for vulnerability, the utility of these indicators have not been demonstrated in Haiti. Moreover, we found no significant statistical relationship between them and child or adult female malnutrition, the only concrete and measurable indicator of vulnerability available. Thus, we selected nutritional status as our dependent variable. Specifically we chose HAZ (Height for Age for children 6 to 59 months of age) as the dependent variable indicating vulnerability. Known as “stunting,” HAZ is recognized as the most useful indicator of chronic malnutrition—i.e. generally a consequence of long term nutritional deprivation– and hence, long term vulnerability (WHO 2013). The proportion of children in the sample who were chronically malnourished is 19.8%. [iv]
In the search for those variables that best determine whether a household is vulnerable–based on the presence of a malnourished child–the variables that yielded no statistically significant relationships and that affirm discussion in the criteria section were as follows:
- WFP Diversity score (variety of foods consumed)
- WFP Consumption index (meals missed on reduced)
- All CNSA composite indexes, including assets, house type, and construction
- Head of household is unmarried
- Head of household is unmarried woman
- Head of household is unmarried man
- Head of household is married couple
- Number of infants in household
- Number of individuals less than 7yrs old
- Number of individuals ages 7 to 25yrs old
- Number of individuals older than 65yrs old
- Number of people less than 18yrs old living outside the home
- Child has chronic health condition
- Child is handicapped
- Child has been ill
- Household has alternative revenue sources
- Household receives transfer payments
- Household receives “other” financial support from organizations
- Head of Household is female (married or unmarried)
- Age of head of household
- Head of household was in school in year ’12 and ’13
- Head of household has chronic health condition
- Head of household is handicapped
- Head of household has been ill
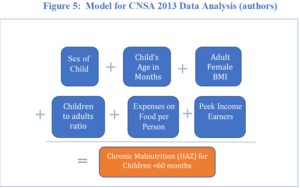
- Variables that did yield statistically significant relationships were as follows:
- Sex of child
- Age in Months
- School (not in school)
- BMI
- Child Ratio (children < 7 years)
- Expenses on Food per person
- Peek “earners” (proportion of adults 26 to 65 years of age
Model
An ordered logit model was chosen to perform the empirical regression analysis. This model was chosen because the desired outcome was not a predicted HAZ z-score but rather the identification of a person belonging to a “Severely Malnourished”, “Malnourished”, or “Good Health” category. In the analysis, the malnutrition category was used as the dependent variable.
Results
For each observation the independent variables used were child’s personal information, health statistics of women in the household, household data, CNSA calculated synthetic food security indexes, and characteristics of the head of household. Eight variables were found to be statistically significant and are explained below: (see Annex for individual charts plotting the following relationships):[v]
- Age: As children get older their health status is more likely to decrease (2% less likely to be of good health at six months; 20% less likely to be of good health at fifty-eight months; p-value 0.000)
- Gender: Female children are more likely to have better health status (5% more likely to be of good health if female; p-value 0.005)
- School enrollment: Children enrolled in school are more likely to have better health status (10% more likely to be of good health in enrolled in school; p-value 0.000)
- Female nutritional status: Children are more likely to have better health status when women in the household have higher BMIs (6% more likely to be of good health if women in house have BMI of 16; 16% more likely to be of good health if women in house have BMI of 38; p-value 0.039)
- Proportion of working children in household: As the percentage of non-working/contributing children in the household decreases, children are more likely to have better health status (2% less likely to be of good health if 9% of household members are <7yrs; 12% less likely to be of good health if 67% of household members are <7yrs; p-value 0.003)
- Dependency ratio: As the number of people who live in the household ages 26-65 increases children are more likely to have better health status (2% more likely to be of good health if one person in the house is age 26-65; 12% more likely to be of good health if five people in the house are age 26-65; p-value 0.018)
- Expenditure: As the amount of money spent per month increases, children are more likely to have better health status (1% more likely to be of good health if family spends $7 per person per month; 21% more likely to be of good health if family spend $172 per person per month; p-value 0.000)
- Education level of households head: If the head of household has at least some post-primary education children are more likely to have better health status (7% more likely to be of good health if head of household has at least some post-primary education; p-value 0.002)
The value the model provides is (i) it mathematically proves each of the above characteristics to be significant, and (ii) quantifies each variable in a meaningful and useful way. While these variables are all statistically significant they fail to accurately predict child nutritional status at the individual level. The actual and predicted observations are shown in the graph below. Blue dots represent real boys and pink dots real girls. Black dots are the predicted outcomes of observations and each black dot is paired to exactly one real observation. A black dots is calculated thusly: take a real observation and use its characteristics as inputs into the model, which outputs a predicted value seen here as a black dot. In a perfect model each predicted value would have exactly the same real value; in other words, it would have fallen exactly on the black line. In the best of models this is an unlikely occurrence. But the model would be a good fit if the observations cluster evenly on either side of the line. Instead, what is seen here is a model with a clear upward bias on health status with predicted values more favorable than most real observations. The reason for the upward bias is that the model and most of the single predictors of malnutrition included do a better job of predicting low vulnerability. For example, among households with the lowest expenditures, knowing level of expenditures offers only a 1% improvement over guessing which household has a malnourished child; but for those households with high expenditures it offers a 21% improvement of random guessing (see Figure 30.1: see Annex for other graphs of models in variable).
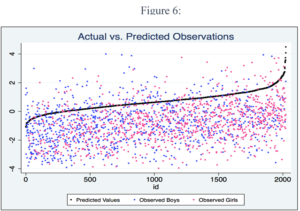
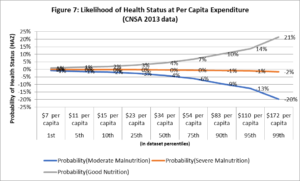
Overall, the best way to sum up the model is that, if we had no more information than that 19.8% of children in the sample are malnourished (the proportion of malnourished children in the sample), than we could have randomly guessed with a probably of being correct at 19.8 % that a child in any given household was malnourished. With the model and knowing all these variables, we can now ‘guess’ with an approximately 12% greater probability of being correct: 32 percent. In short, if we depended on knowing the vulnerability of a household based on this variables, and with the criteria of vulnerability being a chronically malnourished child in the house, we would be wrong 68% of the time.
Behind the Criteria
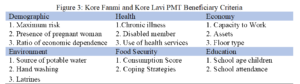
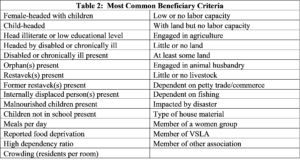
To begin exploring why the PMT models yield such poor results in Haiti, a review of indicators not discussed earlier is provided below. The focus is on indicators explored in the preceding model and the most common criteria that organizations interviewed in the course of the field work use to identify vulnerable households (see Table 2). The utility of the variables are explained in the context of discussions in Geographical Criteria and Beneficiary Unit.
Female Headed Households: There is no evidence that male-headed households are better off than female headed house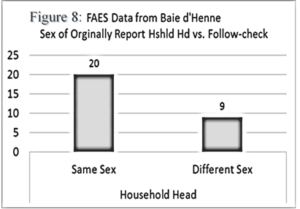 holds; indeed, as discussed earlier on, the contrary may be the case. But the problem is also confounded by cultural expectations regarding gender and household headship. For example, in a 2013 FAES data collection in the North West commune of Baie De Henne, surveyors set up kiosks in 4 habitations (townships) and asked respondents, among other questions, who was head of household and their sex. In the course of the present research we re-visited 29 respondents from the same households and asked the same question. In nine cases (31%) the sex of the household was different than originally reported. And in all nine of those cases the response was different than that of the original respondent. In other words, different household members cited different household heads (Figure 31). Part of the problems derives from the fact that for many people in Haiti, particularly rural areas, households tend to be de facto female headed. Whether a man is present or not and whether the man reports he is running it or not, women tend to make decision regarding the households. The trend is such that a common refrain in rural Haiti is that gason pa gen kay (“men don’t have house,” i.e. because women own them). The trend is related to a tradition where women are the expected heads. In rural Haiti women typically control the household budget, they are the primary disciplinarians of children, and they make 50% or more of the household decisions without the participation of their spouse (EMMUS (2012; 2005; CARE 2013, Schwartz 2009, Murray 1977)
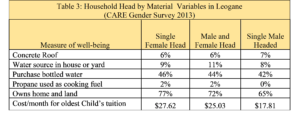
Single Female Headed households: Given the preceding, when households are determined to be vulnerable because of female headship, then it makes more sense to deal with the criteria of “single female headed households,” i.e. households where the female head has no spouse. This was a criteria for virtually all the organizations visited during the course of the investigation. Yet, there are complications here as well. The 2013 CARE International survey in Leogane (N=809), found no significant differences in asset based poverty between households that had a single female head versus those that had both male and female head or a single male head. Moreover, in the same survey—including data from Carrefour (for a total N = 1,629)—for 70% of all households at least one of the two principal breadwinners was female vs. 79% of households in which at least one male was a 1st or 2nd ranked financial contributor. In only 19% of households were both primary breadwinners male and in only 13% are both female. [vi]
House construction: Type of floor, roof, and walls are one of the most commonly cited indicators of vulnerability. The pro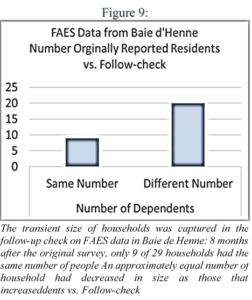 blem with using physical household features is that, while they tell us about the house, they may not reveal much about the people who live in it. This is particularly true in rural areas. As touched on earlier, most rural people in Haiti—adults and children alike–aspire to live in a town, the provincial city and, more than anywhere else, Port-au-Prince. No matter how poorly constructed, undesirable the neighborhood, or vulnerable the plot on which the house is built, second, third, and even fourth houses in towns and cities are principal ingredients in getting children a secondary education—unavailable in the rural areas. Houses in town and urban areas also add significantly to the ease with which members are able to do business in the more lucrative informal urban economy, not least of all the female household head or co-heads’ capacity to trade; they add to male family members capacity to seek temporary work in the city; and they significantly increase the potential for building social capital by extending hospitality to rural family, friends or neighbors who do not have a house in the town or city. Adults who cannot afford to construct second and third houses may invest in family members who construct one; they may rent homes in town or the city; and if nothing else they will seek some kind of stake in the town and urban based homes of relatives, or friends. Indeed, in contemporary Haiti it is unthinkable that one does not have somewhere to stay in the town or city. What all this means is that people in rural Haiti are significantly more likely to invest, not in the quality of construction of rural homes, but those in the town and city. It is tantamount to a rule that people with homes in towns and cities, by virtue of the investment, have shabbier rural homes. None of this is captured in the typical survey or PMT model measuring vulnerability. Seldom if ever are residents asked if their family owns second or third homes.
Crowding (people per room): Limited space versus the number of people in the house suggests poverty. The intuitive explanation is that the household is too poor to build additional living space in response to increased number of people. There are problems assuming that less space and more people is an indicator of poverty. Certainly larger homes suggest higher income. But the housing standard for the lower income mass of households of rural people in Haiti is a two room structure 12 x 20 feet long. The family tends to sleep in the same room. There is usually a single large bed. Children sleep on banana stalk mats on the floor (see Schwartz 2009). The households contract and expand in terms of members over the long and short term in direct proportion, not to the availability of space, but resources. Literally overnight household size can shrink or grow in response to short term changes in resources. Appearance of the migrant fish swells household ranks in fishing villages. The bean harvest swells them on the plains. The March increase in salt harvesting swells then on the littoral flats. Cousins, in-laws, godchildren, nephews, nieces all move to and away from households based on the resources available. Indeed, the irony of using crowding as an indicator of vulnerability is that–similar to so many other supposed indicators of vulnerability– it is quite likely the opposite: fewer rather than more people in a household is a better indicator of vulnerability.
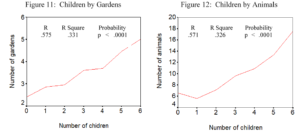
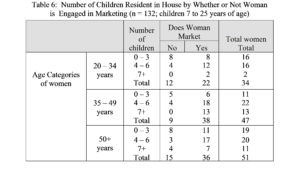
Child Dependency ratios: High numbers of children in proportion to working age adults is another intuitive indicator of vulnerability that may be contrary to expectations. Rural areas are considered safer for the children and a better caretaking environment inducing some parents working in urban areas to send young children back to rural areas to live with their own parents or family until school age. Another complication with using high children dependency ratios as an indicator of vulnerability is that children may in fact reduce household vulnerability. Beginning at about the age 7 children become valuable sources of labor in rural areas, such that the in a 1,586 household survey in Jean Rabel, the author found correlations of over 30% between the number of children resident in a household and the number of livestock and gardens belonging to household heads (Figures 33 and 34; Schwartz 2009:). In the same research the likelihood of a woman being engaged in commerce was strongly associated with the number of children resident in her household; a woman with more than 3 children is 5 to 10 times more likely to be engaged in commerce, regardless of her age, suggesting that the labor of children frees many women to engage in economic activities awa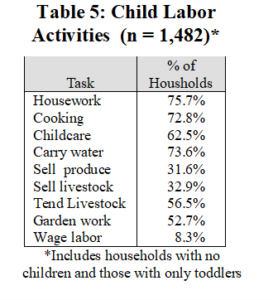 y from the homestead (Table 6. See Schwartz 2009: for a full discussion). More rather than less children can also be a critical factor in withstanding environment shocks. During droughts for example, water sources dry up and farmers must travel farther into remote areas to graze their animals or to cut grass for them. They must then lead the animals farther in the other direction, into more peopled areas where adequate water sources are more common and tend not to dry up as quickly. All of this additional effort translates to the need or more labor and the need for more workers, because rain or no rain, people must eat and they must drink. Food still must be cooked, water found, clothes washed, and at least some animals must be kept alive so that when the drought finally ends there will be something with which to start producing again. Farmers themselves recognize the economic advantage of children vis a vis the demanding labor regimes. In Far-West Haiti, one of the harshest natural environments in Haiti, teams of surveyors asked a random sample of 68 male and 68 female household heads the question, ‘which family is better off, the, one with 3 children or one with 6 children?’: 59% of respondents chose the family with 6 children (see Schwartz 2009:chapt 13). When presented with the hypothetical scenarios, ‘if an NGO offered to pay you 500 dollars per month, every month for the rest of your life to not bear children would you agree?’ Rather than responding with a joyous “yes!” that outsiders who think children are a burden on the poor might expect, 90% said “No.” The responses were captured on recording devices and transcribed. Most respondents were perplexed why anyone would contemplate accepting such an offer. Common were remarks such as,
No. I would not agree. That couldn’t help you at all. If I am getting $500 a month and I do not have a child to say, go there, take this gallon, go get some water for me. Look at me, I’d be making $500 dollars a month and all the time things would be getting worse. Not better. No. Not better. Worse. Things would be getting worse.[vii] (fifty-one-year-old father of two)
The most common explanation for refusing the hypothetical $500 included the importance of children when the respondent is sick or injured (see also Table 8, below). More than 50% of respondents mentioned illness with comments such as,
No. Because let’s say you have money. You go find someone to do something for you. He doesn’t do it. But children. As soon as I am sick, look at my child making food for me, washing clothes for me, doing things for me. And if it was money, it wouldn’t be doing anything for me.[viii] (thirty-year-old father of four)
I don’t understand what you are saying. Children are there to help you. Your children do your work. I don’t know who takes care of things at your house.[ix] (sixty-year-old father of thirteen)
Elderly: Similar to the problems with using high numbers of small children as an indicator of poverty and vulnerability, adults seeking care for elderly parents often choose to send them to the ‘family farm’ or town in the province where care is less expensive or cost free; cost of living in other respects low; crime low; and where the elderly can conduct petty commerce or work in gardens. Moreover, organizations tend to create criteria for “aged”–such as over 70 years of age–that do not always fit. We found in the course of the research at least two cases where elder beneficiaries spontaneously complained about being defined as vulnerable, explaining that they are the most productive members of the household. Not least of all, during the past century and up to the present, rural Haitians bore an average of 7.1 children per person. What this means is that as the typical rural farmer in Haiti ages, the quantity of direct living descendants grows underneath them like a pyramid of social capital rising from the sand. They also tend to have a lifetime of accumulated investment in land. And what both accumulated wealth and large numbers of living descendants mean for measures of vulnerability is that the presence of a feeble old man or woman with a cane confined to the household may be an indication, not of poverty, but wealth and land ownership or remittances from adult children, grandchildren or great grandchildren living overseas, the migration of which the elder as likely as not financed in years past.
Handicapped: Little argument can be made against the probability that a disabled person is more likely to be vulnerable than his or her healthy counterpart. The problem comes in applying the logic at the household level. Data on how many handicapped people are in rural Haiti could not be found. But we know anecdotally the numbers are few. We can assume that the low numbers have to do with food insecurity and high labor demands associated with survival. We can also reasonably assume that the survival of those who are alive is, for the most part, not owed to State or NGO interventions (only a few programs in rural Haiti have traditionally targeted the disabled, most of those are religious missions). Thus we can deduce that the few handicapped who survive in rural areas are more than likely alive because they are being cared for and supported by members of the household in which they live. Hence, presence of disabled may be a better indication that a household is not vulnerable but rather capable of supporting and caring for non-productive member. In support of the point, in one of the earliest reports on Targeting in rural Haiti the researchers noted that,
In normal Haitian household feeding patterns, it should be noted, infants, young children, pregnant and lactating mothers, the ill, and the elderly are not disadvantaged. Quite the contrary. The team found that, in times of scarcity, these particular groups receive priority in feeding, even when the more productive household members go without. (USAID 1994:23)
Meals per day: A principal indicator of food security explored in many surveys is meals per day (CNSA/CFSVA 2007; CNSA 2013). But meals and what comprises a meal are cultural constructs. Popular class Haitians eat one principal meal per day, at noon. They also eat one semi-meal (breakfast) and something in the evening. The morning or midmorning snack is typically reported as a meal. That of the evening is not. Or so it might be supposed. The fact is that reporting may also be idiosyncratic. Rural Haitians have an array of cultural constructs regarding consumption of a meal versus a snack. For example, while someone from the US might consider a large bowl of cereal a meal a rural Haitian probably would not. On the other hand, people in rural Haiti define a meal as eating food with salt, manje sel (rice, beans, yams, plantains, meat or fish sauce). Turning the issue around, the criteria of manje sel means that while a US citizen would qualify salted crackers as non-nutritious snack, popular class Haitians may consider salted crackers a type of meal. Thus, for reported ‘meals per day’ to be accepted as a valid criteria, it would first have to be shown that respondents were consistently reporting in such a way that it reflected nutritional deprivation, a moot point as meals per day yields no statistical significance in PMT explorations such as that presented with the CNSA data earlier on. Another point about meals is that cooking them often has more to do with availability of dry fuel –wood in rural areas and charcoal in towns—making missed meals a variable also dependent on weather patterns.
Coping Strategies Index (CSI): Sometimes used as the dependent variable for proxy means tests, WFPs Coping Strategy Index is the sum of points assigned to five weighted questions about household food rationing strategies in the week prior to the interview (see CNSA/CFVSA 2007: 82). For example, questions include, “did anyone in the house miss any meals in the past week because of lack of income.” Or, “did people in the house reduce the size of meals or eat less preferable foods because of a lack of income.” In the case of CNSA/CFSVA 2007 the score could range from 0 to 63. Problems with the CSI begin with it being dependent on self-reporting, not observation. In the course of the research no study demonstrating the accuracy of the measure in Haiti was found. Thus, it is not known whether the CSI in Haiti measures food rationing strategies or respondent tendency to prevaricate in the hope of attaining aid. Unless we are to assume that respondents are uniformly incapable of making the connection between reported food rationing and the probability of getting aid—a great underestimation of ‘peasant’ power of reasoning– it is difficult to see how asking about food rationing differs from asking people outright if they are vulnerable or hungry. Just as problematic is the fact that, even if reporting is candid, the Coping Strategies Index (CSI) is a snapshot, useful in times of crisis but only as an indicator of temporary status, i.e. the seven days preceding the interview. As if all the preceding were not problematic enough, the utility of the CSI measure for identifying a small number of beneficiary households is reduced by the high number of respondents who report rationing. In the CNSA/CFSVA 2007, the following percentage of respondents reported rationing for each of the questions asked:
- Reduce number meals in the past week: 38.8%
- Reduce quantity of food : 45.7%
- Borrow food or depend on the aid of family or friends outside of the household :10.3%
- Eat foods that are less costly or less preferred : 40.7%
- Reduce food eaten by adults in favor of the children :26.2%
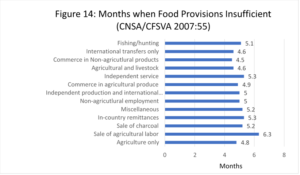
Months of Food Rationing: Months of food rationing per year is another indicator of vulnerability that varies little between those practicing different livelihood strategies, once again suggesting that shocks and coping are somehow leveled between groups through social redistributive mechanisms.
Food Consumption Score: Consumption score has the potential to discriminate to fine degree between households. Food diversity is calculated based on reported household consumption for 23 foods that can be lumped into 8 categories (the exact number of categories varies in different surveys). But once again there is the issue of reporting error. The measure is based on self-reporting. It is not known what portion of respondents, rather than having low diversity scores, are simply not forthcoming with answers. Consumption scores do not correlate well with other indicators of vulnerability. For example, households principally dependent on agricultural labor and charcoal are relatively secure in terms of Coping Strategies; yet they rate the poorest on consumption (diversity). And as with the CSI above, with the exception of emergency situations all the preceding are moot points because the Food Consumption Score is a snapshot that, if it reveals anything at all about true food insecurity, is limited to the seven days preceding the survey—those days about which the surveyors inquire–making it more useful in times of crisis than as a long term indicator of chronic food insecurity.
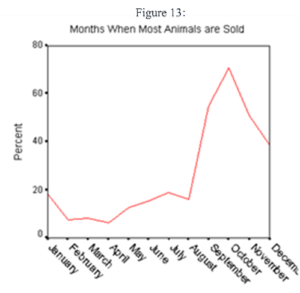
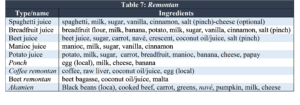
Income, Expenditures and Assets: Rural Haitians, similar to small farmers everywhere, would prefer that their neighbors do not know what they have and, we can infer, are not enthusiastic about sharing the information with strangers—i.e. the surveyors. This is not a novel observation. Most organizations, including WFP (undated_b) and USAID (2013) recommend not trying to gather data on income (see also CNSA/CFVSA 2007:36). Thus, expenditures are a better indicator than income. But during crisis, expenses may not decline as expected. They may stay the same or they may increase as families sell off goods and investments to buy food. Charcoal production or harvest trees hitherto preserved for hard times. Detecting this change, indeed, measuring income at all is a difficult and unverifiable task. Another complication with expenses in rural Haiti is that they are seasonal, as with planting and school tuition, something reflected in data on livestock slaughters (see Figures 35-36 and Table 7). Even if we assume accurate measures of income, expenditures and assets there are problems, particularly with regard to income and expenses as indicators of chronic vulnerability. The sheer number of very poor people makes the measure almost useless. In 2001, the last time estimates of income were made for a national sample, 56% of Haitians were considered “extremely poor” (living on less than US$1.25 per day); 76% were “poor” (living on less than US$2 per day). The situation is worse in rural areas where 67% of people were extremely poor; 88% were poor.[x] If essentially everyone has daily income differentials measured in pennies, it does little good to use the category as an indicator of differential vulnerability. Moreover, use of the data for targeting assumes that household economic status is static. The models do nothing to capture the fact that households and individuals are daily, weekly, monthly, and annually crossing back and forth across arbitrary poverty lines. Nor does the technique capture social capital, arguably the most important variable in rural livelihood security.
Dependence on Agriculture/commerce/charcoal: A common criteria used to indicate vulnerability is dependence on a particular livelihood strategy, most commonly agriculture commerce or fishing. And it may sometimes be the case that, for example, a single female headed household depends only on commerce. Or a male headed household is dependent on agriculture. But overwhelming this in not the case. The vast majority of Haitian households are engaged in multidimensional livelihoods strategies. Thus, while the Haitian government in the form of MARNDR (2009) estimates that about 80% of Haiti’s 52,000 fisherman are engaged in full time fishing, all fishing households in communities visited during the course of fieldwork for the Haitian Red Cross (Schwartz 2013) also depended on agriculture, livestock rearing, and making charcoal– mainstays of livelihood and survival, not just in the region studied, but throughout Haiti (see ###). All these activities integrated through female trade, providing another common household source of income; and all have complementary specialties for which people are paid such that even a woman who is predominately engaged in itinerate trade may work a jounen planting crops in a neighbors field one day, gather salt per jakout in a coastal salt pan another day, and work as a porter carrying fish traps from a rural market to a fishing village by the sea on the next day. When all else fails, the production, packaging, shipping, and sale of charcoal is the primary fallback on which people in rural Haiti survive crisis, something regrettable in terms of deforestation, but that, far more often than any NGO or state intervention, has acted to stave off famine and it has done so for more than two centuries.
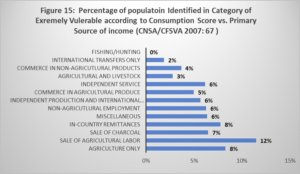
Returning to the main point, identifying people as dependent on any one economic activity ignores the reality of integrated rural livelihood strategies and it ignores the vast array of petty income earning opportunities. Most researchers know this, but still pursue discrepancies between primary dependence. The weakness of using primary dependence as an indicator of vulnerability comes through with the observation that vulnerability in one category might not be the same in another. For example, the 2007 CFSVA study found that charcoal vendors/producers were among the poorest groups, but they had one of the lowest food insecurity scores. Thus, this arguably makes the poor charcoal vendors less vulnerable than comparable groups. Another example of the complexities that come with basing vulnerability on what are for most mult-dimensional livelihood strategies is that in the same survey those households primarily dependent on agriculture were found to be experiencing high food insecurity, but those primarily dependent on both agriculture and livestock were found to be experiencing the lowest food insecurity. The problem here is that not owning livestock is a temporary status for most households. All households in the rural areas own livestock at least some of the time and most own livestock most the time. None never own livestock. It is simply part of the household productive strategy and the very reason for the existence of households—i.e. to produce so as to sustain its members. As seen earlier, households sell livestock off to meet seasonal needs—such as costs of planting or, most importantly, to pay school tuition for children. They also sell livestock off to deal with emergency costs, such as medical care or to survive environmental calamities such as when crops and animals are lost to drought, floods or blight (see Table 7). Thus, how many of those reported as dependent primarily dependent on agriculture only had lost their animals to thieves or sold them to meet expense associated with some type of shock? In effect, dependency on a single source of income begs the question, once again, about transient poverty.
Children not in school: Haitians everywhere put a high value on their children’s education. The trend is such that for many observers it is a defining characteristic of being culturally Haitian. Parents or guardians who do not put their children in school are criticized. Nevertheless, 10% of all Haitian children 6 to 12 years of age are not in school (EMMUS 2012). These children are arguably the most vulnerable children. But are they representative of the most vulnerable households? At least some of these children are living as domestic servants with non-biological kin. Thus, the presence of children not in school is in some cases an indicator of the capacity to take on servants. Moreover, many children are, at any given time, only temporarily out of school. Most impoverished children and adults can recount a period when they were not in school, almost always explaining that their family was suffering hard times, often as a result of an illness of a parent or themselves. So once again there is the issue of transient poverty or the fluidity of the mass of rural poor. Those children 6 to 12 years of age who have never gone to school may belong to the most vulnerable or poorest households in terms of the six years span in question; but other families may be dipping below them for shorter periods, rising over the poverty line and falling again.
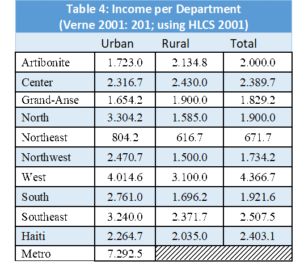
Land Owners: Eighty percent of people in rural areas own at least some land; 70% cultivate land (Stetten and Egset 2004). The average total land ownership in Haiti is 1 hectare (IHSI 2003). Sletter and Egset (2004) use the HLCS (2001) to show that that an increase in 1 hectare of land results in only a 2% increase in income. Thus, statistically speaking, a person with 6 hectares–the upper 5% of the rural household land ownership in rural Haiti–only has an income level 12% greater than those with no land at all (the difference between $1.50 and $1.75 per household member), making land ownership a variable useful, perhaps, in excluding the wealthiest landowners, but dubious as an indicator of vulnerability (see also Verne 2008). Moreover, quantity of land owned is more contingent than quality of the land, especially regarding irrigated land. Other points that detract from the importance of landless as an indicator of rural household is that the highest income households derive most of their wealth, not from land, but from skilled craftsmanship, fishing, and healing or shamanic practices (see Schwartz 2009: Wiens and Sobrado 1998:5)
Malnutrition: The most effective criterion for defining vulnerability is arguably malnutrition. Regarding the individual it is nearly perfect because, by definition, whether from disease or actual nutrition deprivation, the individual is in a measurable state of personal crisis. One possible problem arises when we elevate the criteria to the level of household, such that a household with a malnourished adult or individual is defined as vulnerable. During the course of the fieldwork for this study, three separate clinic staff and four NGO workers claimed that because of household targeting linked to malnourished children some families deliberately deprive children of food so that the entire household may qualify for aid disbursements. Even if not true or rare, if we wait for disease or malnutrition before intervening we have essentially missed the opportunity to intervene and the individual is more than vulnerable: he or she is a victim.
Summary of Beneficiary Criteria
The most common criteria organizations use to define a rural Haitian household as vulnerable are problematic. In some cases where there is abundant data, such as with female headed households, the statistics suggest that organizations may have the equation backwards: female headed households may, for whatever reason, be indicative of better food security. The search for statistically valid indicators and PMT models does not solve the riddle. In cases of infrastructure variables, there is little practical reason—and little statistical support– to expect they are useful in discriminating household nuance of vulnerability among rural households in Haiti, the bulk of which, by standards anywhere else in the world, are vulnerable. As seen, source of potable and general purpose water, electricity, waste disposal, and even latrines are consequences of proximity to urban areas, NGO and State services. In this way they may be useful as geographical criteria, but they do not help in discriminating vulnerability levels among individual households.
Moreover, some commonly used indicators may be indicative not of high, but low vulnerability. High numbers of elderly and young children may suggest remittances; high numbers of children over 7 years of age may suggest greater work capacity; crowding may indicate a temporary high level of resources; presence of handicapped may indicate long-term capacity to care for a non-contributing household member. Nor do PMT models offer support for most variables that international and State use in targeting. Setting aside malnutrition (which was used as the dependent variable, i.e. evidence of vulnerability), in the analysis of the most recent CNSA survey data, no variable offered more than a slight improvement over random guessing. The best that can be said of Proxy Means Test algorithms or single indicators is that they are useful in excluding non-vulnerable households from targeting: households that are well constructed, that have cars and motorcycles, high expenses, and where all the children are in school, can be readily eliminated from lists of vulnerable. But for the bulk of the population, already extremely poor, they do little to differentiate between households in which its occupants are living on $0.98 per day vs $1.20 per day or even 1.50 per day. There is not even good reason to believe that they would flush out differences between “poor” and “extremely poor;” and to date no study has demonstrated they could do so with anything approaching a reasonable degree of confidence.
Transient household poverty: When we use fixed criteria we assume that the household is somehow static. But we know intuitively, anecdotally and from the available evidence that they are not static. We saw that rural Haitian households grow and shrink is size according to available resources. A household can also fall into poverty rapidly. A sick mother who is a principal contributor of income through commerce, or a sick father who is principal caretaker of animals and agricultural plots, means lost income and medical bills that can plummet the household into extreme vulnerability. The severity of household shocks is such that in the 2007 CNSA/CFSVA survey three of the five most common shocks respondents reported suffering in the previous year can be classified as internal to the household: specifically, accident/illness, death, and animal disease (Table 8). The highest percentage of people that reported having been impacted by shock was 70.7%; that was for “Increases in Food Prices.” But three times as many people reported that the most severe shock the household had suffered in the preceding year was from disease or accident suffered by a family member, precisely the reasons many respondents in Jean Rabel were seen giving as advantages of having many children
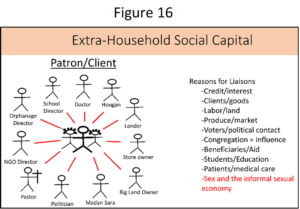
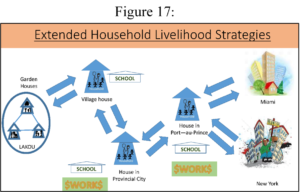
Social Capital: As seen with the multiple integrated livelihood strategies on page 31, few if any rural households in Haiti would risk dependence on a single source of subsistence. Those subsistence and survival strategies they do depend on are not limited to production. Not discussed is second tier security net of social capital. Households tend to be kinship based, each contributing household member has his or her own network of family, friends, associates and in many cases lovers who facilitate access to resources such as loans, jobs, favors or, as in the case of remittances and foreign aid (access to children sponsorship, Food and Cash for Work), provide direct transfers of goods or cash, all of which make up low income Haitians most significant source of social security. These linkages are difficult to quantify and just as difficult to capture, as evidenced by their absence in the criteria seen earlier. But we can gauge their importance by the one national measure that does exist, overseas remittances; in the aggregate the single greatest source of revenue for the entire country, estimated at a minimum of 2 billion in 2012 (per capita US$200). If informal transfers are included, remittances may account for as much as half of the country’s revenue (IRIN 2010). Figure 16 illustrates the variety of social relationships that may yield material support to a household member and the corresponding material underpinnings of the relationship. Figure 17 is an illustration of inter-household linkages.
Bibliography
Aba Grangou 2012. WFP/CNSA. Raphy Favre. Unpublished
ALNAP. 2012 Responding To Urban Disasters: Learning From Previous Relief And Recovery Operations November www.alnap.org/resources/lessons.
Bastien, Remy. 1961. Haitian rural family organization. Social and Economic Studies 10(4):478–510.
Berggren, Gretchen, Nirmala Murthy, and Stephen J Williams. 1974. Rural Haitian women: An analysis of fertility rates. Social Biology 21:368–78.
Borgatti, S.P. 1992. ANTHROPAC 4.0 Methods Guide. Columbia: Analytic Technologies.
CARE 2013a The Kore Lavi Program (United States Agency for International Development Bureau for Democracy, Conflict and Humanitarian Assistance Office of Food for Peace
CARE 2013b Gender Survey CARE HAITI HEALTH SECTOR Life Saving Interventions for Women and Girl in Haiti Conducted in Communes of Leogane and Carrefour, Haiti
CFSVA (Comprehensive Food security and Vulnerability Analysis) – 2007/2008. Overseen by WFP (World Food Program) and CNSA (Coordination Nationale de la Sécurité Alimentaire)
CNSA/Few Net 2009 Cartographie de Vulnébilité Multirisque Juillet/Aout 2009
CNSA/Fews Net 2005 Profils des Modes de Vie en Haïti
Concern and Fonkoze 2008 Chemin Levi Miyo – Midterm Evaluation Concern Worldwide, by Karishma Huda, and Anton Simanowitz
DINEPA 2012 Challenges and Progress on Water and Sanitation Issues in Haiti National Water and Sanitation Directorate Direction Nationale de l’ Eau Potable et de l’Assainissement – www.dinepa.gouv.ht
Echevin, Damien 2011 Vulnerability before and after the Earthquake. World Bank Policy Research Working Paper 5850.
http://www.worldbank.org/en/topic/communitydrivendevelopment/brief/cdd-targeting-selection.
ECHO 2011 Real-time evaluation of humanitarian action supported by DG ECHO in Haiti 2009 – 2011 November 2010 -April 2011
EMMUS-I. 1994/1995. Enquete Mortalite, Morbidite et Utilisation des Services (EMMUS-I). eds. Michel Cayemittes, Antonio Rival, Bernard Barrere, Gerald Lerebours, Michaele Amedee Gedeon. Haiti, Institut Haitien de L’Enfance Petionville and Calverton, MD: Macro International.
EMMUS-II. 2000. Enquête Mortalité, Morbidité et Utilisation des Services, Haiti 2000 (EMMUS-II). Cayemittes, Michel, Florence Placide, Bernard Barrère, Soumaila Mariko, Blaise Sévère. Haiti: Institut Haitien de L’Enfance Petionville and Calverton, MD: Macro International.
EMMUS-III. 2005/2006. Enquête mortalité, morbidité et utilisation des services, Haiti 2000 (EMMUS-II). Cayemittes, Michel, Haiti: Institut Haitien de L’Enfance Petionville and Calverton, MD : Macro International.
FAFO 2001 Enquête Sur Les Conditions De Vie En Haïti ECVH – 2001 Volume II
FAFO 2003 Enquête Sur Les Conditions De Vie En Haïti ECVH – 2001 Volume I
GoH 2004 Decree de la Constitution regarding Communal Section LIBERTÉ ÉGALITÉ FRATERNITÉ DE LA RÉPUBLIQUE RÉPUBLIQUE D’HAÏTI DECRET Me BONIFACE ALEXANDRE PRÉSIDENT PROVISOIRE
Government of Haiti 2010 Action Plan for National Recovery and Development of Haiti
Gravlee, C. C., Bernard, H. R., Maxwell, C. R., & Jacobsohn, A. 2013 Mode effects in free-list elicitation: Comparing oral, written, and web-based data collection. Social Science Computer Review 30:119–132.
Gravlee, Lance Dept. of Anthropology, University of Florida The Uses and Limitations of Free Listing in Ethnographic Research
Hashemi, Syed M., and Aude de Montesquiou. 2011. “Reaching the Poorest with Safety Nets, Livelihoods, and Microfinance: Lessons from the Graduation Model.” Focus Note 69. Washington, D.C.: CGAP, March.
Himmelstine, Carmen Leon 2012 Community Based Targeting: A Review of CBT programming and literature
Hoskins, A. 2004. Targeting General Food Distributions: Desk Review of Lessons from Experience. Rome, WFP).
IRIN 2010 Haiti: US Remittances Keep the Homeland Afloat. UN Office for the Coordination of Humanitarian Affairs
http://www.irinnews.org/report/88397/haiti-us-remittances-keep-the-homeland-afloat
Kaufman, Michael. 196. “Community Power, Grasrots Democracy, and the Transformation of Social Life.” In Michael Kaufman and Haroldo Dila Alfonso (eds.), Community Power and Grasrots Democracy: The Transformation of Social Life. London and Otawa: Zed Boks and IDRC.
Kolbe, Athena R., Royce A. Hutson , Harry Shannon , Eileen Trzcinski, Bart Miles, Naomi Levitz d , Marie Puccio , Leah James , Jean Roger Noel and Robert Muggah 2010 Mortality, crime and access to basic needs before and after the Haiti earthquake: a random survey of Port-au-Prince households In Medicine, Conflict and Survival
Krishna, Anirudh 2010 “One Illness Away: Why People Become Poor and How they Escape Poverty” Oxford University Press
Lamaute-Brisson, Nathalie 2009 Pour le ciblage des interventions en matière de sécurité alimentaire. Note d’orientation WFP
Lavallee, Emmanuelle, Anne Olivier, Laure Pasquier-Doumer, and Anne-Sophie Robilliard 2010 Poverty Alleviation Policy Targeting: a review of experiences in developing countries.
Lowenthal, Ira 1984. Labor, sexuality and the conjugal contract. In Haiti: Today and tomorrow, ed. Charles R. Foster and Albert Valman. Lanham, MD: University Press of America.
Lowenthal, Ira. 1987. Marriage is 20, children are 21: The cultural construction of conjugality in rural Haiti. Dissertation, Johns Hopkins University.
Lundahl, Mats. 1983. The Haitian economy: Man, land, and markets. New York: St. Martin’s.
Maguire, Robert E. 1979 Bottom-Up Development in Haiti. Washington, DC: The Inter-American Foundation,
Mansuri, Ghazala and Vijayendra Rao 2013 Localizing Development Does Participation Work? International Bank for Reconstruction and Development / The World Bank
Maxwell, Daniel, Helen Young, Susanne Jaspars, Jacqueline Frize 2009 Targeting in Complex Emergencies Program Guidance Notes. Feinstein International Center, Tufts University
McClure, Marian 1984 Catholic Priests And Peasant Politics In Haiti: The Role Of The Outsider In A Rural Community A paper prepared for presentation at the Caribbean Studies Association meetings St. Kitts May 30 – June 3
Morton, Alice, 1998 The NGO Sector In Haiti: The Challenges of Poverty Reduction, World Bank Volume Il: Technical Papers Report No. 17242-HA
MPCE 2004 Carte de pauvreté d’Haïti, à partir des données de l’ECVH (2001)
Murray, Gerald 1977 The evolution of Haitian peasant land tenure: A case study in agrarian adaptation to population growth. Ph.D. dissertation, Columbia University, Department of Anthropology.
Nicholls, David. 1974. Economic dependence and political autonomy: The Haitian experience. Occasional Paper Series No. 9. Montreal: McGill University, Center for Developing-Area Studies
Pace, Marie with Ketty Luzincourt 2009 Cumulative Case Study: “Haiti’s Fragile Peace”
PAM/CNSA 2007 l’Analyse Compréhensive De La Sécurité Alimentaire Et De La Vulnérabilité
PNUD 2000 Bilan commun de pays du PAM, du FNUAP, de l’UNICEF, de l’OMS/OPS et de la FAO. RPP
Richman, Karen E. 2003. Miami money and the home gal. Anthropology and Humanism 27(2): 119–32.
Romney, A. K., S. C. Weller, and W. H. Batchelder. 1986. Culture as consensus: A theory of culture and informant accuracy. American Anthropologist 88:313–38.
Rotberg, Robert I., and Christopher A. Clague. 1971. Haiti, The politics of squalor. Boston: Houghton Mifflin.
Sali, Jamil 2000 Equity and Quality in Private Education: The Haitian Paradox, Compare, 30(2), 163–178, (p. 165) 3.
Schreiner, Mark 2006 The Progress out of Poverty Index TM: A Simple Poverty Scorecard for Haiti
Schwartz, Timothy. 1998. NHADS survey: Nutritional, health, agricultural, demographic and socio-economic survey: Jean Rabel, Haiti, June 1, 1997–June 11, 1998. Unpublished report, on behalf of PISANO, Agro Action Allemande and Initiative Developpment. Hamburg, Germany.
Schwartz, Timothy. 2000. “Children are the wealth of the poor:” High fertility and the organization of labor in the rural economy of Jean Rabel, Haiti. Dissertation, University of Florida, Gainesville.
Schwartz, Timothy. 2004. “Children are the wealth of the poor”: Pronatalism and the economic utility of children in Jean Rabel, Haiti. Research in Anthropology 22:62–105.
Scott, Lucy and Andrew Shepherd 2013 Microeconomic Indicators of Development Impacts and Available Datasets in Each Potential Case Study Country
Sletten, Pål and Willy Egset. “Poverty in Haiti.” Fafo-paper, 2004.
Smillie, Ian 2001 Patronage or Partnership: Local Capacity Building in Humanitarian Crises Published in the United States of America by Kumarian Press, Inc. 1294 Blue Hills Avenue, Bloomfield, CT 06002 USA.
Smith, Jennie M. 1998. Family planning initiatives and Kalfouno peasants: What’s going wrong? Occasional paper/University of Kansas Institute of Haitian Studies, no. 13. Lawrence: Institute of Haitian Studies, University of Kansas.
Smith, Jennie M., 2001 When The Hands Are Many Ithaca: Cornell University Press.
Smucker, Glenn Richard. 1983. “Peasants And Development Politics: A Study In Haitian Class And Culture”. New School For Social Research. Pages: 511.
Steeve Coupeau 2008: 104 History of Haiti. Greenwood Press: Westport Ct.)
UN 1996 Final report on human rights and extreme poverty, submitted by the Special Rapporteur, Mr. Leandro Despouy’ (28 June 1996) UN Doc E/CN.4/Sub.2/1996/13
UNDP 2011 Cash Programming in Haiti Lessons Learnt in Disbursing Cash Suba Sivakumaran (Subathirai.sivakumaran@undp.org)
USAID (United States Agency for International Development) 1983 Haiti: HACHO Rural Community Development. AID Project Evaluation Report No. 49
USAID 1994 Rapid Assessment Of Food Security And The Impact Of Care Food Programming In Northwest Haiti.
USAID 2013 Performance Indicators Reference Sheets for FFP Indicators
http://www.usaid.gov/sites/default/files/documents/1866/PIRS%20for%20FFP%20Indicators.pdf
Verner, Dorte 2008 Making Poor Haitians Count Poverty in Rural and Urban Haiti
Based on the First Household Survey for Haiti. The World Bank Social Development
Sustainable Development Division World Bank Policy Research Working Paper 4571
WFP (undated_b) Monitoring & Evaluation Guidelines United Nations World Food Programme Office of Evaluation and Monitoring Via Cesare Giulio Viola, 68/70 – 00148 Rome, Italy Web Site: www.wfp.org
WFP 2006a TARGETING IN EMERGENCIES WFP/EB.1/2006/5‐A
WFP 2006b Thematic Review of Targeting in Relief Operations: Summary Report. Ref. OEDE/2006/1
WFP 2009 Targeting in Complex Emergencies, Programme Guidance. Feinstein International Center, Tufts Universtiy
WFP 2013 Basic Guidance Community-Based Targeting
WFP/EB.A/2004/5‐C).
White, T. Anderson And Glenn R. Smucker 1998 Social Capital and Governance in Haiti. In Haiti: The Challenges of Poverty Reduction, World Bank Volume Il: Technical Papers Report No. 17242-HA
WHO 2013. World Health Statistics
http://www.who.int/gho/publications/world_health_statistics/2013/en/
Wiens, Thomas and Carlos Sobrado 1998 Rural Poverty in Haiti In Haiti: The Challenges of Poverty Reduction, World Bank Volume Il: Technical Papers Report No. 17242-HA
Wiesmann, Doris, Lucy Bassett, Todd Benson, and John Hoddinott 2009 Validation of the World Food Programme’s Food Consumption Score and Alternative Indicators of Household Food Security. IFPRI Discussion Paper 00870
World Bank 1998 Haiti: The Challenges of Poverty Reduction (In Two Volum-les) Volume Il: Technical Papers Report No. 17242-HA
World Bank 2011 Working Research Paper Echevin2011 Vulnerability before and after the Earthquake. by Damien Echevin World Bank Policy Research Working Paper 5850. http://www.worldbank.org/en/topic/communitydrivendevelopment/brief/cdd-targeting-selection.
World Bank 2013 Design & Implementation: Targeting and Selection. http://www.worldbank.org/en/topic/communitydrivendevelopment/brief/cdd-targeting-selection
Zaag, Raymond Vander, 1999 Encounters Of Development Knowledges, Identities And Practices In A Ngo Program In Rural Haiti Doctoral Dissertation, Department of Geography and Environment Studies Carleton University Ottawa, Ontario, Canada
Zak, Marilyn and Glen Smucker HAITI DEMOCRATIC NEEDS ASSESSMENT May 1989 USAID (United States Agency for International Development) Office of Caribbean Affairs Bureau for Latin America and the Caribbean
NOTES
[i] The exact phrasing is, “d’un outil de ciblage unique qui peut distinguer les ménages selon son niveau de vulnérabilité et que tous les programmes peuvent utilizer”
[ii] Thus, the presence or absence of electricity is a function of distance to the electric pole. For example, areas of the Plateau Central that are electrified are so simply because of the good fortune of being located near the path the electric lines were laid in getting electricity to the cities. Moreover, no studies were found demonstrating that electricity brings economic benefits to those households that do have access to it. Anecdotally we know of no benefits other than lighting to see and read by and perhaps a television. For example, while 11% of rural households report owning a television, only 2.7% own a refrigerator (EMMUS 2012).
[iii] It is interesting to note regarding infrastructure that even roads yield counter-intuitive data: Sletten and Egset (2004:17) report that the rural poor and extremely poor are, respectively, 4 and 3 times more likely to have a road leading to their house than the non-poor.
[iv] HAZ strongly corresponded with the Child MUAC (upper arm circumference), WHZ (Weight for Height; referred to as wasting and an indicator of acute malnutrition and hence short term vulnerability), and WAZ (Weight for Height; an intermediate variable that can be conceptualized as a combination of impact of chronic and acute malnutrition). HAZ for children also correlated strongly with reproductive age female body mass index (BMI) (see Annex). A limiting factor in the use of nutritional variables was that they were available only for children 6 to 59 months of age: 816 of the 3,501 households had no children in this age range, leaving 2,685 households in the sample with children ages (ages 6-60 months) containing for each personal information and health statistics. For only 2,025 of the 2,686 children was it possible to pair health statistics with household data. For these 2,025 observations HAZ z-score were analyzed because they provided the greatest variability in the data: 18.2% suffered from moderate malnutrition; 1.3% suffered from severe malnutrition. All things being equal, the likelihood of a child in the dataset is malnourished is 19.5%.
To determine the Z scores—number of standard deviations from the mean for normal children–the database of 2,685 children was analyzed using the Emergency Nutrition Assessment (ENA) tool and the World Health Organization 2005 Malnutrition Standards. ENA automatically removed outliers (greater than 4 standards deviations above or below the mean for normal children) and unlikely observations (based on correlations with other nutritionals observations), a total of 124 children, leaving WHZ z-scores of 2,561 children. According to the tool and the WHO malnutrition standards, 10% (256 children) suffered from moderate malnutrition and 0.6% (16 children) suffered from severe malnutrition),
The Emergency Nutrition Assessment tool uses WHZ (weight-for-height z-scores) as an indicator of malnutrition. While this is a logical indicator of “sudden” or “immediate” malnutrition we do not believe it is a reliable measure for “long-term” malnutrition. To measure “long-term” or “perpetual” malnutrition we believe HAZ (height-for-age z-scores) is a better tool and is more suitable for Haiti’s nutritional situation.
The ENA tool omits observations in its automated Plausibility Check for the following reasons: “probably height is incorrect”; “probably weight is incorrect”. These reasons were identified as the cause for 200+ observations to be flagged as “improbable” because WHZ, WAZ, and HAZ scores were too varied. These metrics, if all measuring malnutrition, should be correlated, but certainly not perfectly correlated. But as shown below this not what we see in the data:
WAZ: (WAZ, HAZ r=0.61); (WAZ, WHZ r=0.64)
HAZ: (HAZ, WAZ r=0.61); (HAZ, WHZ r= -0.20)
WHZ: (WHZ, WAZ r=064); (WHZ, HAZ r= -0.20)
Using the 2,631 children observations that fall within four standard deviations of the global mean, the following distribution of health status was seen in the population. As shown below, using HAZ provides the greatest variability among the three categories “severely malnourished”; “malnourished”, and “good health”.
WAZ: Severely Malnourished 1%; Malnourished 11%; Good Health 88%
HAZ: Severely Malnourished 4%; Malnourished 18%; Good Health 78%
WHZ: Severely Malnourished 1%; Malnourished 5%; Good Health 94%
[v] As mentioned above, 816 of the 3,501 households had no children in this age range, leaving 2,685 households in the sample with children ages (ages 6-60 months) containing for each personal information and “health statistics” the term health statistics is limited to (i) chronic disease, (ii) recent illness, and (iii) disability/handicap. This information was collected for all people in the household survey regardless of age. Fewer households than children were used because in many situations two or more children in the malnutrition data were coded as belonging to the same household.
Observations/records: 2,689
Unique households: 1,978
Households w/ 6 children: 2
Households w/ 5 children: 5
Households w/ 4 children: 13
Households w/ 3 children: 80
Households w/ 2 children: 482
Households w/ 1 child: 1,396
247 were removed b/c the Emergency Nutritional Assessment application identified their records as suspicious–i.e. outliers. These results are found in the attached file ENA Plausibility Check 140203.rtf.
[vi] Nor is there any suggestion that even being female disposes individuals to being disadvantaged. On the contrary, throughout Haiti mothers and father prefer daughters over sons (EMMUS 2012, Schwartz 2000, 2013). The Understanding Children’s Work Project (2006), concluded that Haitian boys more often than girls work outside the home, they work harder than girls, and they work for longer hours than girls. In her 2006 Gender Assessment for USAID, Gardella emphasized that Haitians show no gender preference in educating their children. In both urban and rural areas more Haitian females have finished primary school than males (86.6% to 85.2% for urban areas and 73.2% to 72.4% in rural areas) and more urban based females have completed secondary school (41.9 %to 39.1%). Only with regard to completion of secondary school in rural areas do boys prevail (20.0% to 11.7%: see EMMUS 2012). Indeed, for those concerned about gender differential treatment of children a good case can be made that it is Haitian boys, not girls, who are in need of special attention: in addition to the educational differences favoring girls, the 2005-06 EMMUS found that chronic malnutrition was significantly greater among boys (25% vs 20%: p.162); the same was true for child mortality (143/1,000 boys to 132/1,000 for girls 0 to 62 months of age: p. 86).
[vii] Non. M pa ka dako, sa pa ka itil ou anyen. Wi, eskè m-ap touche 500 dola le mwa, epi m pa gen yon moun pou m di ale la, al pran ti gallon, al pran empè dlo pou mwen. Ala m-ap touche 500 dola le mwa, ala se pa desann m-ap desann, se pa grandi m-ap grandi. Tout tann,, m pap desann? . . . Premiè byen yon moun se pitit-o. Chyen ap manje o.
[viii]. Non. Paskè ou gen lajan la, si ou al jwenn yon moun pou fe yon bagay pou ou, li rete la. Min ti moun an, depi m malad la, gade pitit um ap bouye pou mwen, ap lave pou mwen, ap bagay pou mwen. E te lajan li te ye li pa tap fe anyen pou mwen.
[ix]. Pou ki sa m fe ti moun? Mwen pa konprann. Ti moun la pou sevi … Tout kondi sevis pa-ou. Pa-ou, kondi sevis pa ou. M pa ka konprann sa-k mennen lakay ou.…
[x] Echevin (2011) used date for durable assets from the 1995, 2000 and 2005 EMMUS’ to come up with a similar indicator of rural poverty assets. He tested the measure against malnutrition and came up with a similar rates of the extremely poor and poor.