This post is useful for a) the description of the formal versus informal market chains in Haiti and b) data from several random boutik (neighborhood stores) surveys. You will find information on the estimated number of residences per boutik, the use of credit, distribution channels, and inventories. Data is drawn from studies we conducted on behalf of the Clinton Foundation and the American Peanut Council (see Clinton Foundation Report and the see American Peanut Council Report.
The Haitian Boutik
There are three components of the internal marketing system in Haiti: 1) the internal rotating marketing system that deals largely with local produce (see this post about Haiti’s Internal Rotating Market System ), 2) the food preparation economy that includes a cottage industry of food processors, street vendors and restaurants (see this post about Haitian Street Food), and 3) the formal import marketing system. This post deals predominantly with one aspect of this latter formal important market chain, specifically the Boutik (traditional Haitian neighborhood store). A Word about the Formal Import Market System. But to fully appreciate the role of the boutik system in Haiti, it is important to first briefly review the formal market system.
The Formal Market System in Haiti
The formal sector of the Haiti market system deals almost entirely with imported goods. Traditional this was the channel for imported tools such as machetes and hoes, lamp fuel, and a few food staples such as imported smoked herring and cod. With regard to processed foods, including staples such as rice, sugar, pasta, wheat flour, cooking oil, milk, and prepacked snack foods, the formal system has only become important as a function of the urbanization of the past 50 years. The formal system can be thought of as having 3 segments. At the highest level are major distributors who import mass quantities of processed foods—cookies, crackers, cheese puffs, cheese spreads, sugared beverages, as well as staples such as rice, flour, sugar, corn flakes, and cooking oil. Sometimes these distributors repackage products with their own logos, branding, and culturally appropriate marketing that appeals to the interests of Haitian consumers (read this post about Elite Merchant Monopoly on Bad Snack Foods). The next level of the system is bifurcated. One path leads to modern urban, air-conditioned supermarkets offering a plethora of brands from the US and Europe that compete with repackaged and locally labeled goods sold to wealthy and upper-middle-class consumers (roughly 10% or less of the population, overwhelmingly concentrated in Port-au-Prince). The other path leads to smaller distributors in major cities, provincial towns, and rural areas. These wholesale outlets, or depo, supply small shops or boutik, and individual merchants who sell directly to consumers on the street or in open-air markets (although many depo also sell retail).
The formal market channel in Haiti has at least two key characteristics that make it distinct from those in developed countries. 1) There are what might be considered non-subsistence goods—such as hair products, deodorants, and toilet paper—but these p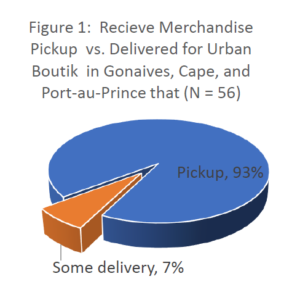 roducts represent a small portion of what is found in the formal market system. The majority of products emphatically have to do with subsistence rather than wants. Even snack foods should be thought of as low-cost nutritional resources, not as recreational “wants.” 2) There is an almost total absence of formal distribution networks for the imported foods. This means that, unlike in developing countries or even the neighboring Dominican Republic where distributors and redistributors of both local and imported products have well developed delivery networks, the burden of restocking in Haiti rests almost entirely with redistributors and retailers (and not the importers or wholesalers). This is true for both rural and urban areas (see Figure 1). There are a few exceptions at the time the research for this post was conducted (2014), such as snack-maker Stanco, which had its own distribution network and could effectively leverage it to get products onto the local market. But the role of these deliveries is almost entirely urban and minuscule compared to the gross movement of good. For example, Stanco had only 15 trucks and they are limited to the few paved roads.
Proportion of Purchases Made in Informal vs. Formal Market Venues
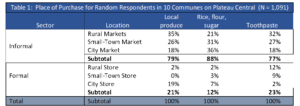
As suggested by the observations above, it should be understood that in terms of purchase points for consumers, the informal market sector is the principal distribution channel throughout Haiti. Illustrative of the point is that on the Plateau Central, even toothpaste—a definitively formal sector, industrial product–is primarily purchased in the open markets (see Table 1). [i]
Credit and the Formal Sector Advantage
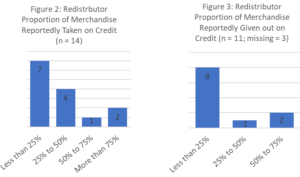
Although the informal economy prevails in Haiti, the incursion of imported items into the informal market gets a significant boost from differential access to credit. In the formal market economy one sees subsidies and credit operant at every level. Three of five of the distributors interviewed reported receiving more than 50% of merchandise on credit. Every one of the 14 redistributors received credit from distributors and gave credit to clients (Figures 2 and 3); 82% of boutik owners interviewed give credit to clients (Figure 4).
The informal sector traditional economy has its mechanisms of credit but they are different. Farmers provide produce on credit to madan sara (itinerant traders) who in turn provide short-term credit to resellers at the urban distribution point. But the credit tends to be for small quantities and is short-lived—measured in days. If one takes a loan from and informal sector lender, the cost of the credit exceeds 20% per month. Even if credit is obtained from NGOs or credit unions the cost is typically 3% to 6% per month. In contrast, in the formal sector credit is abundant and free.
What the differential access to and cost of credit means in terms of advantage is that formal sector entrepreneurs do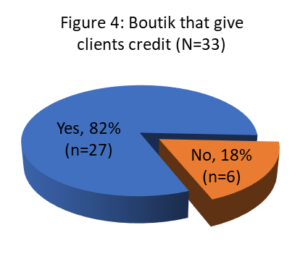 relatively big business with no capital and they pay nothing; entrepreneurs in the informal sector tend to do petty business, and they must either have their own money or pay exorbitant fees to borrow. The situation is such that at any given time 8% of informal sector entrepreneurs are operating with funds that they got from taking formal sector merchandise on credit and then selling at below market costs, creating the ironic spectacle of impoverished informal sector actors using profits earned from redistributing local produce to subsidize the wealthier formal import sector (see this pose about the Komesan vs. Madam Sara).
Stores/Boutik Survey for the American Peanut Council (APC)
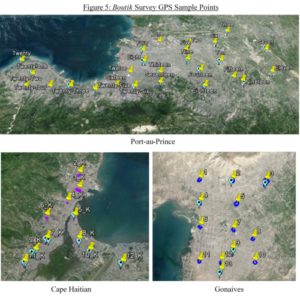
In 2014 we conducted a systematic random survey of 79 stores (called boutik) in Port-au-Prince, Gonaives and Cape Haiti. We interviewed owner or people responsible for 56 of those boutik. A questionnaire was applied to gauge demand for snacks, fortified foods, and peanut-based prepared foods, and to estimate the number of formal neighbor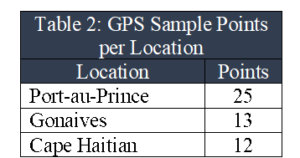 hood boutik per household. Questions focused on client purchasing preferences and credit. The survey was complemented with complete inventories at 15 boutik. In addition, 30 boutik owners were interviewed via telephone regarding the most popular snack foods and turnover rates. Boutik were located using a random systematic selection of GPS points in each of the three urban locations. Using Google Earth, an approximately 100-meter square area was delineated. The defined area was located using the app Mapswithme Pro. All houses in the defined area were counted, as were boutik, thus allowing us to come up with an estimate of the number of boutik per residence [i.e. (total number of boutik)/(total number of residences) per 100-meter square area]. Owners and/or managers at each boutik were then asked questions about credit, turnover rates, and customer preferences.

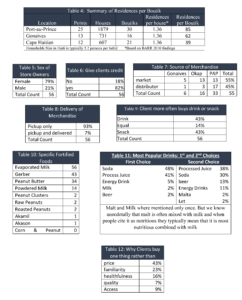
Below is a summary of what we found for the total 3-city sample followed by inventories for all 56 stores:
- There was 85 residences per boutik in Port-au-Prince, 62 residences per boutik in Gonaives, and 39 residences per boutik in Cape Haitian (see Table 4).
- 82 percent of all store owners were female (see Table 5).
- 71 percent give clients credit (see Table 6).
- 55 percent buy their merchandise from the popular market vs. 45 percent who buy from warehouses (see Table 7).
- 93 percent go to pick up all their stock vs. 7 percent who get some of it delivered (see Table 8).
- 43 percent report that the most common item sold is beverages, 43 percent report snacks are the most common item sold, and 14 percent report that they sell snacks as commonly as beverages (see Table 9).
- The most commonly sold fortified food-type is evaporated milk (which in Haiti, unbeknownst to most consumers, has as it’s primary ingredient palm oil and not milk) (see Table 10).
- Far and away the most popular drinks are sodas at 48 percent followed by processed fruit juices at 41 percent (see Table 11).
- Regarding the primary determinant of the consumer choice, 43 percent of boutik owners said by price, 23 percent said familiarity, 16 percent said healthfulness, 7 percent said quality and 9 percent said access/availability (see Table 12).
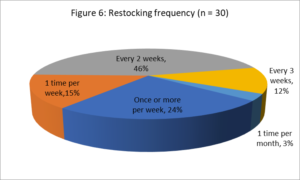
Thirty-nine percent of the 30 respondents in the boutik owner telephone said they purchased their merchandise from marketplaces, while a narrow majority (52%) had some other distributor. When asked how frequently they purchased new stock, a strong plurality (45%) said every two weeks, while 15% said once per week, and 24% said one or more times per week. Fifteen (15%) of the respondents reported purchasing less than once every two weeks (Figure 6).
Preferences Adults vs. Children in the Port-au-Prince Sub-Sample
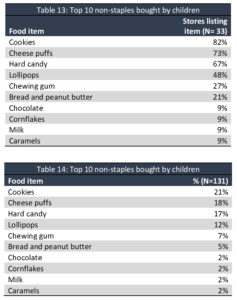
Taking a closer look at the Port-au-Prince sample of 33 respondents: cookies and cheese puffs also ranked as the top two items purchased by children (Table 13). Specifically, 82% of respondents listed cookies among their top (5) items purchased by children, with these items representing 21% of the 137 products listed in boutik inventories (Table 14). Cheese puffs were listed by 24 respondents (73%) and made up 18% of the items listed as the most commonly purchased by children. One peanut-based food – bread (or, in one case, cassava) with peanut butter – was among the top 10 non-staple foods purchased by children. It was listed at 7 of the 33 (21%) and accounted for 5% of the listed items.
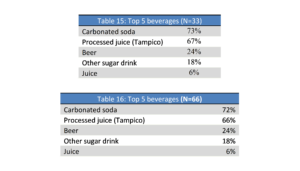
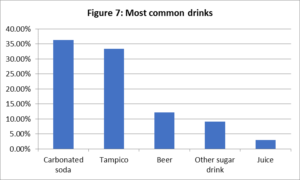
Among drinks, carbonated sodas were the most frequently stocked. Twenty-four of the 33 respondents, or 73%, listed sodas as one of their two most commonly purchased beverages, accounting for 36% of the 66 responses. Processed juice (Tampico) was the second most commonly cited drink. It was listed by 22 respondents (67%) and accounted for a third of all responses. The other most common drinks were beer, other types of sugared drinks, and canned juice (Tables 15 and 16).
Full Inventories
In a rapid assessment of 15 of the 33 Port-au-Prince store inventories, the average inventory contained 38 items (Table 17). There was considerable overlap, with 12 of the 15 stores (80%) selling Kola (domestic and regional carbonated soft drinks), toilet paper, Coca-Cola, spaghetti, hard candies, and sugar. Eleven (73%) sold Malta, Chico, cooking oil, and Bongu brand milk. Ten (67%) stocked laundry soap, eggs, beer, rice, and cornflakes. A majority (53%) sold Divin (cheap sugary wine from the DR), Tampico fruit punches, ground corn, Toro energy drink, 7-Up, tomato paste, and Gerbers (baby food). For a full list of inventory items and frequency, see Table 18 below (71 items listed only one time have been omitted):

NOTES
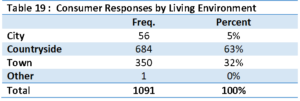
[i] Origins of consumers in the 1,091 respondent survey from 10 Communes in the Plateau Central